Social media management.
Always-on channel management that turns a content plan into consistent, meaningful growth.
I build sustainable channel systems that connect planning, publishing, community and reporting. The aim is not simply to post more, but to make every channel more useful to its audience and the wider business.
- A repeatable content rhythm
- Stronger audience relationships
- Reporting tied to business goals
Proof from the
channels I run.
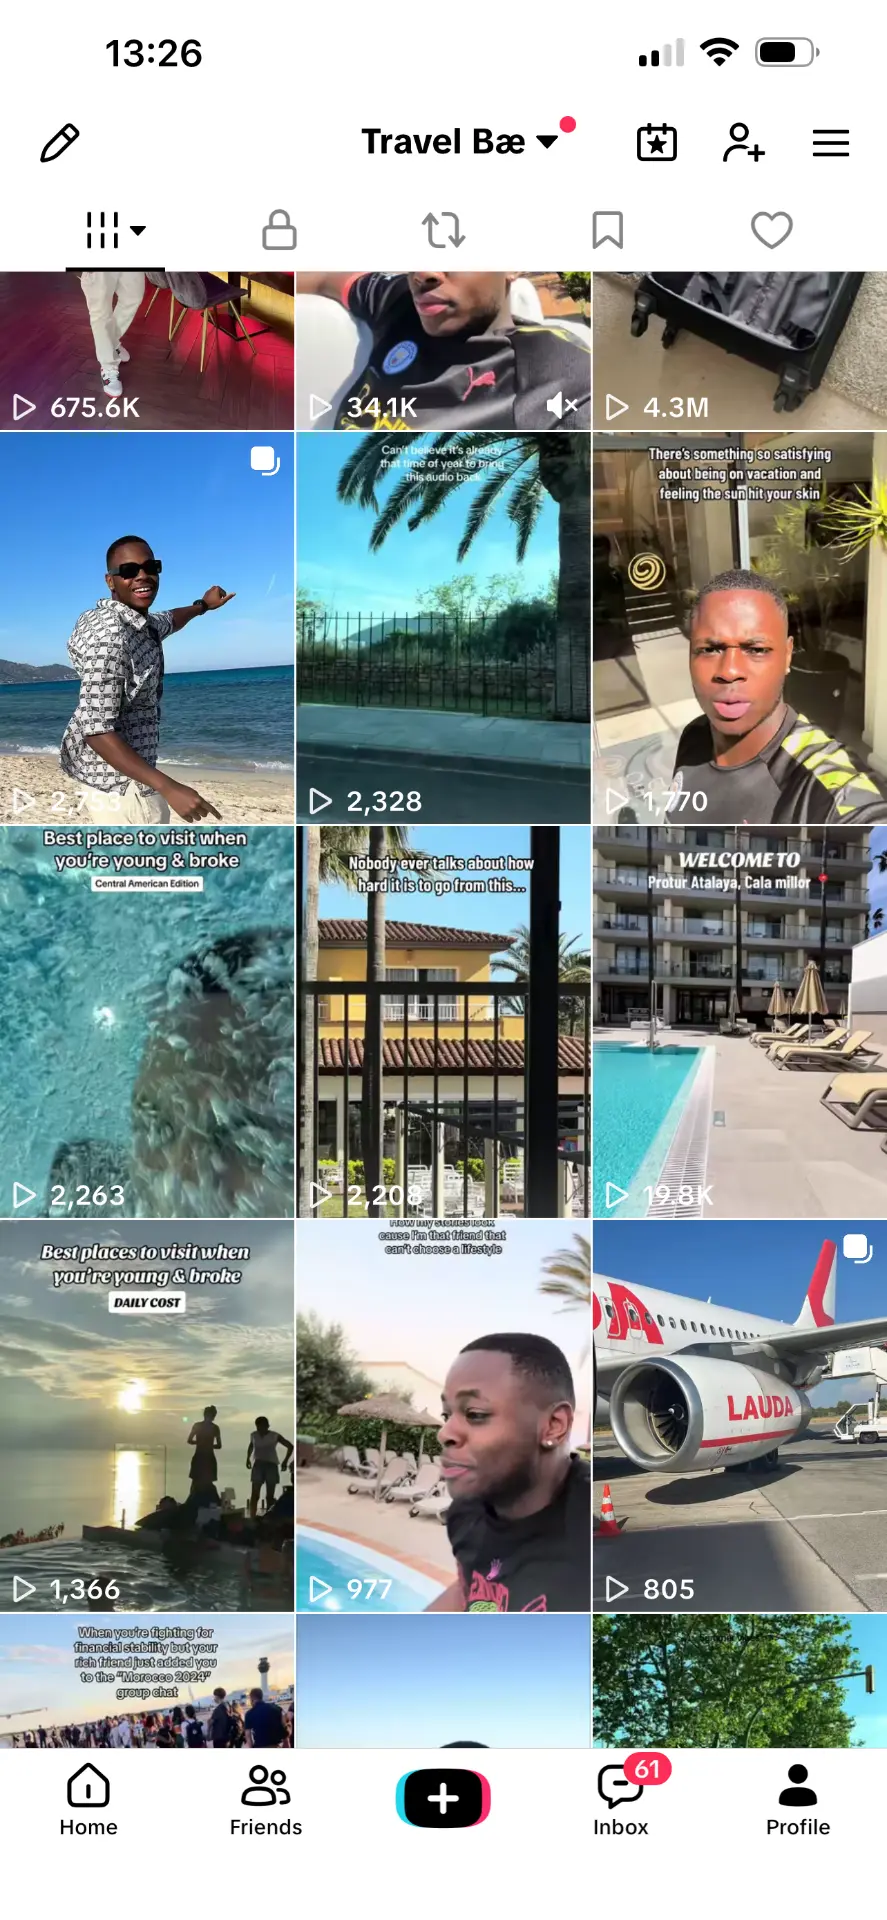
Live account screens from Play Factore and Travel Bæ — follower growth, reach and the content behind it.
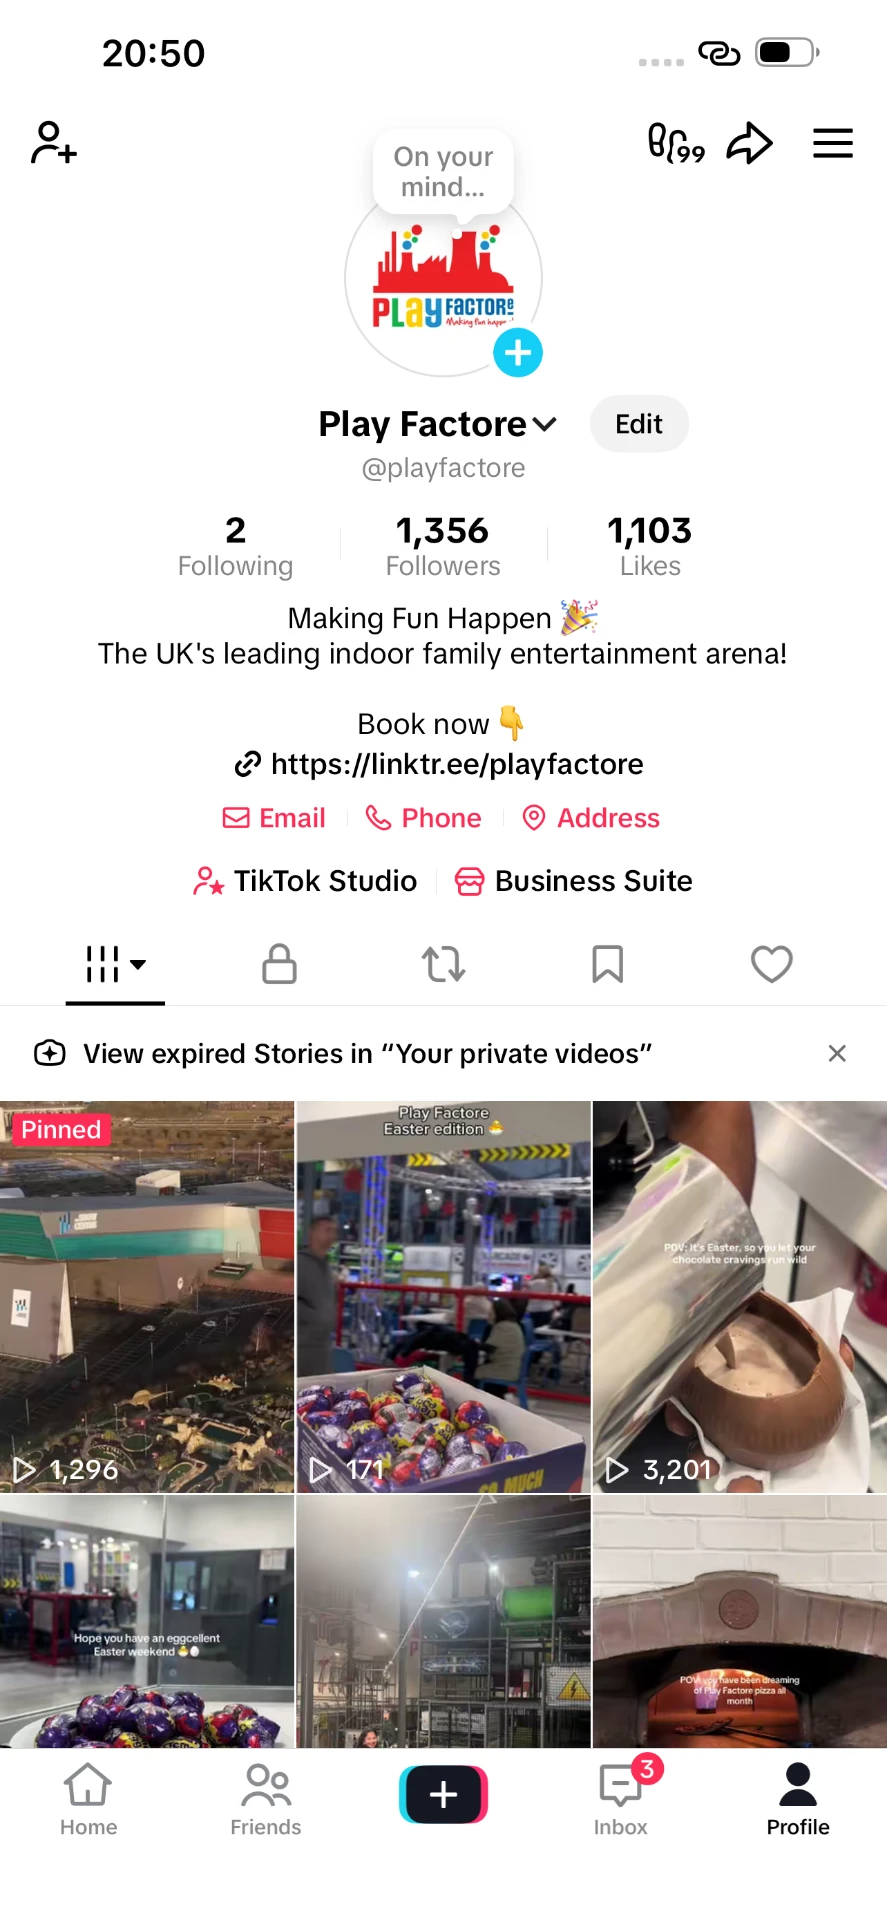
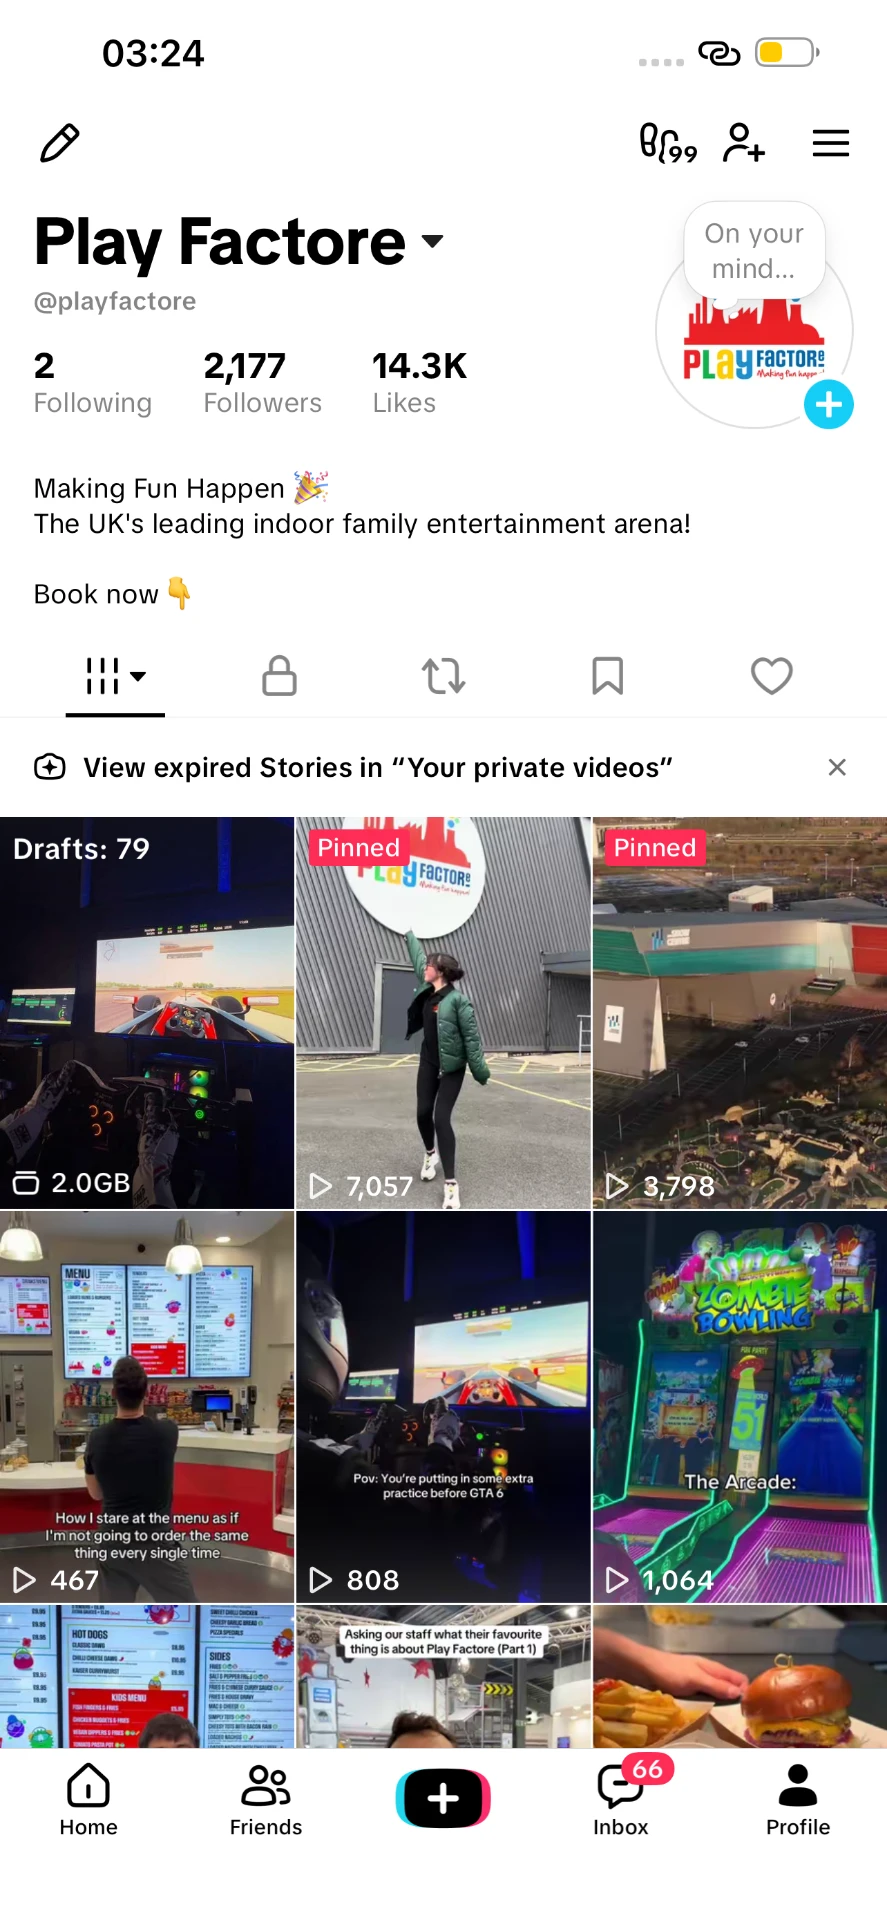
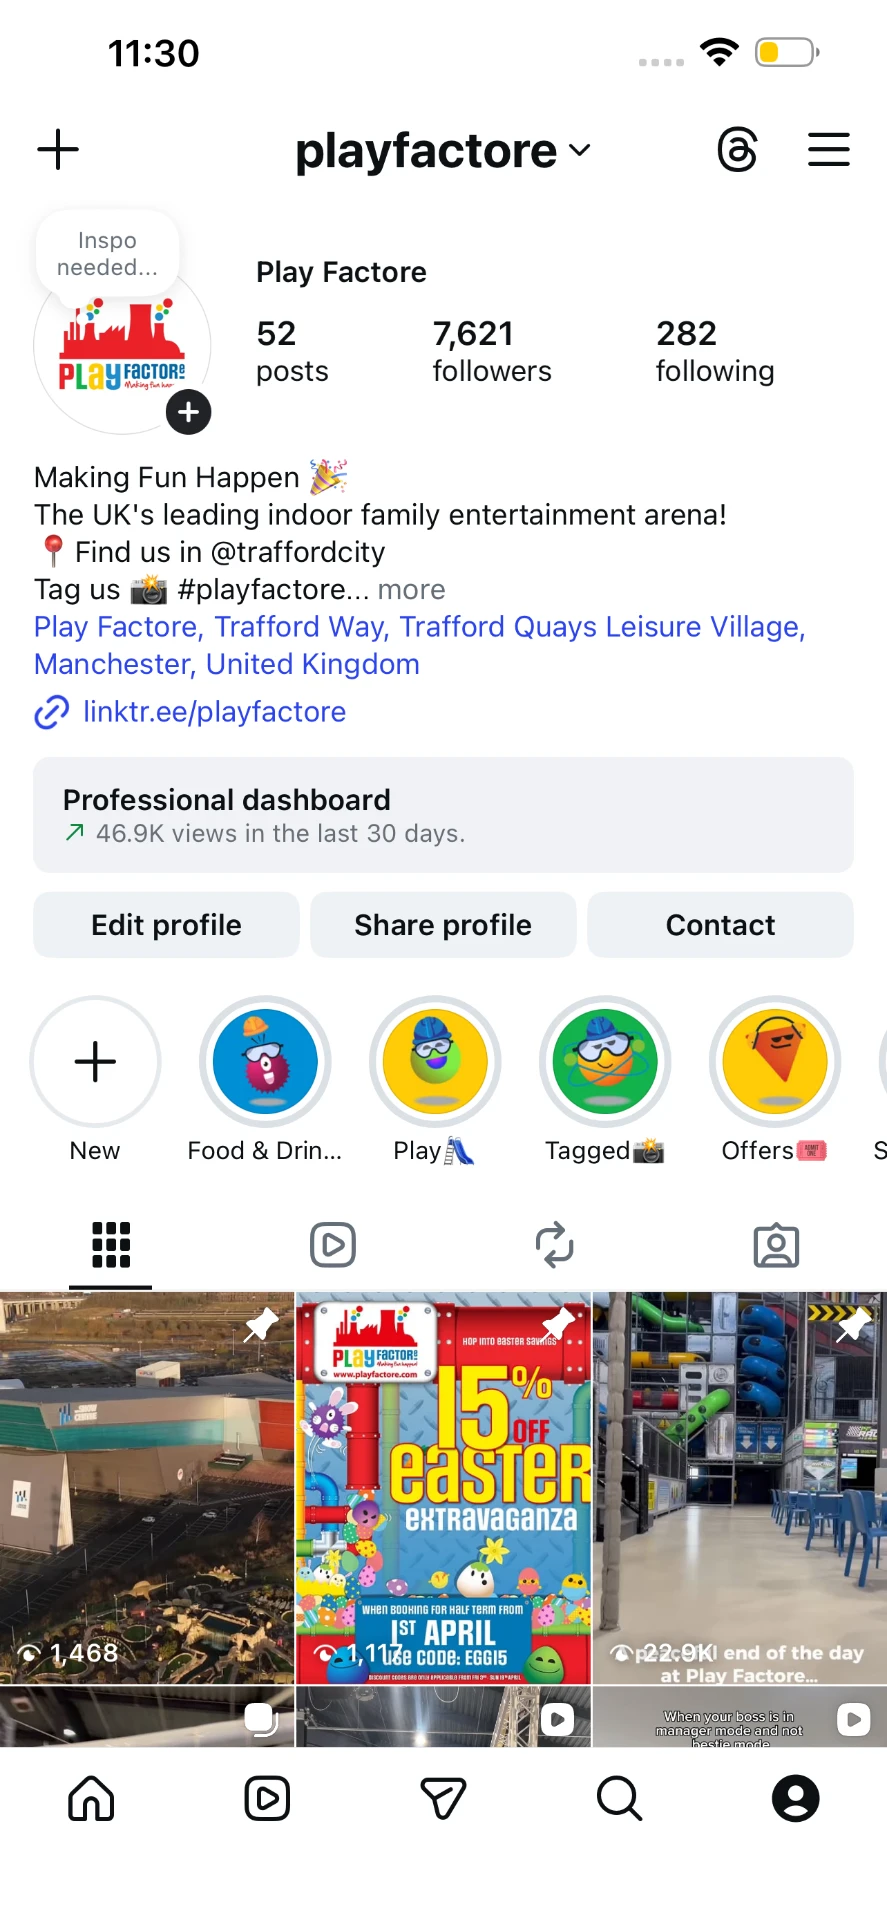
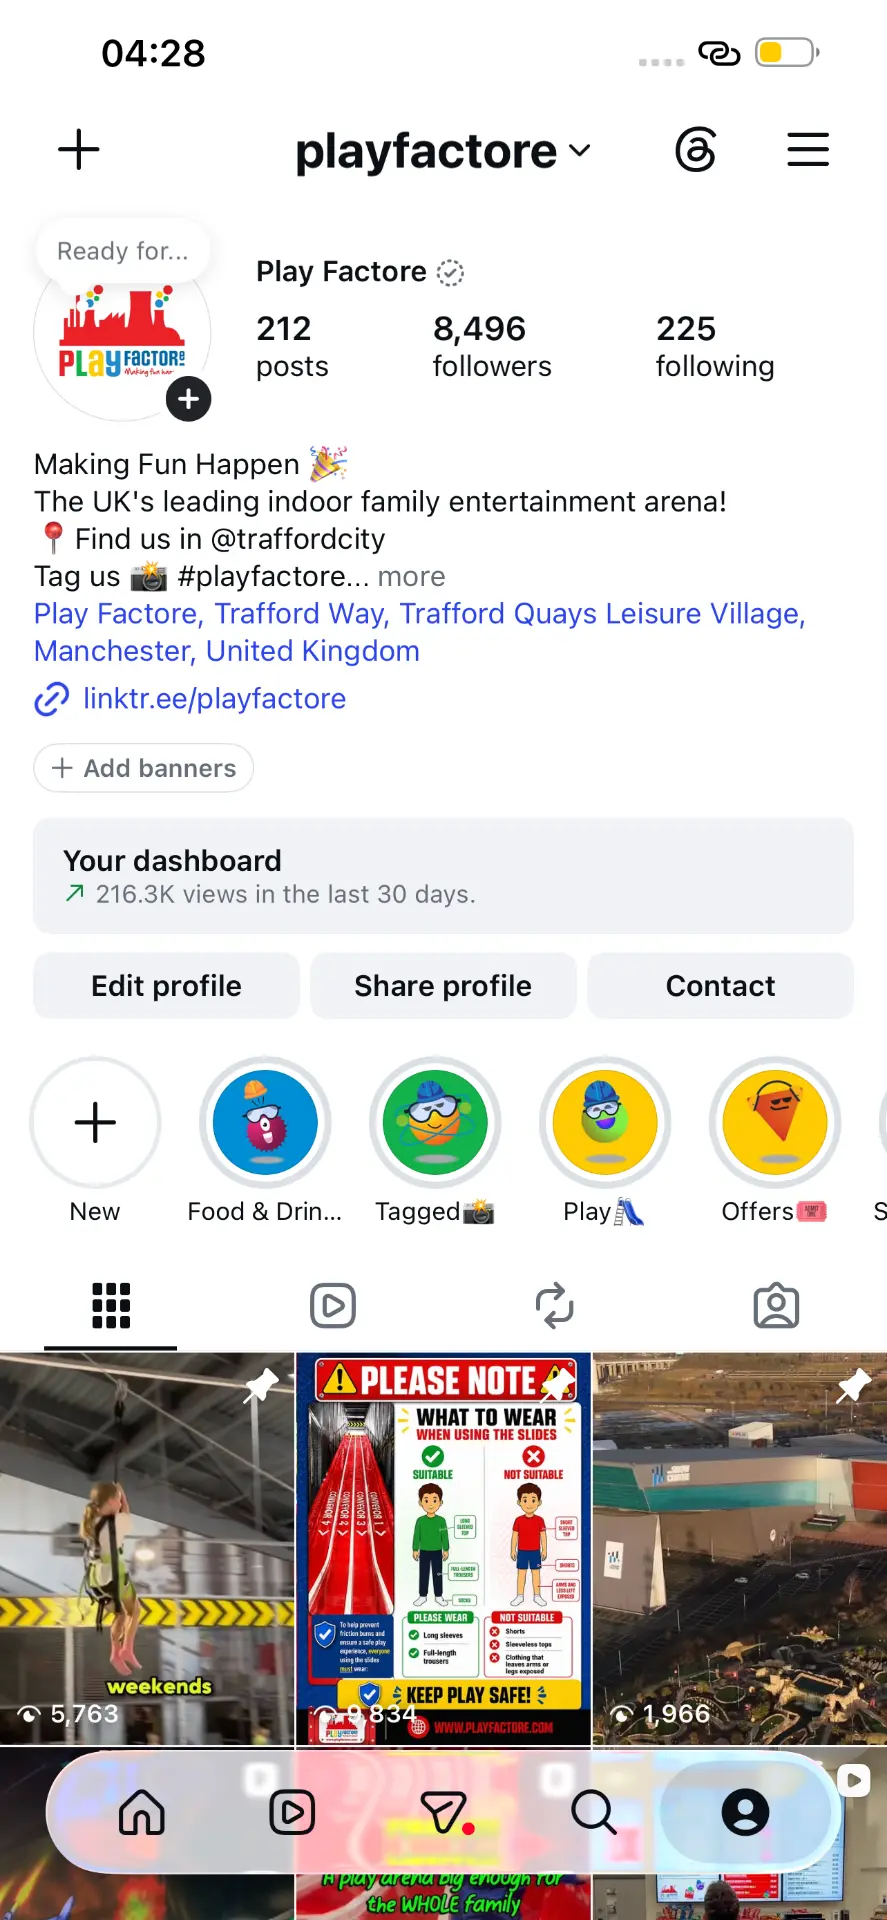
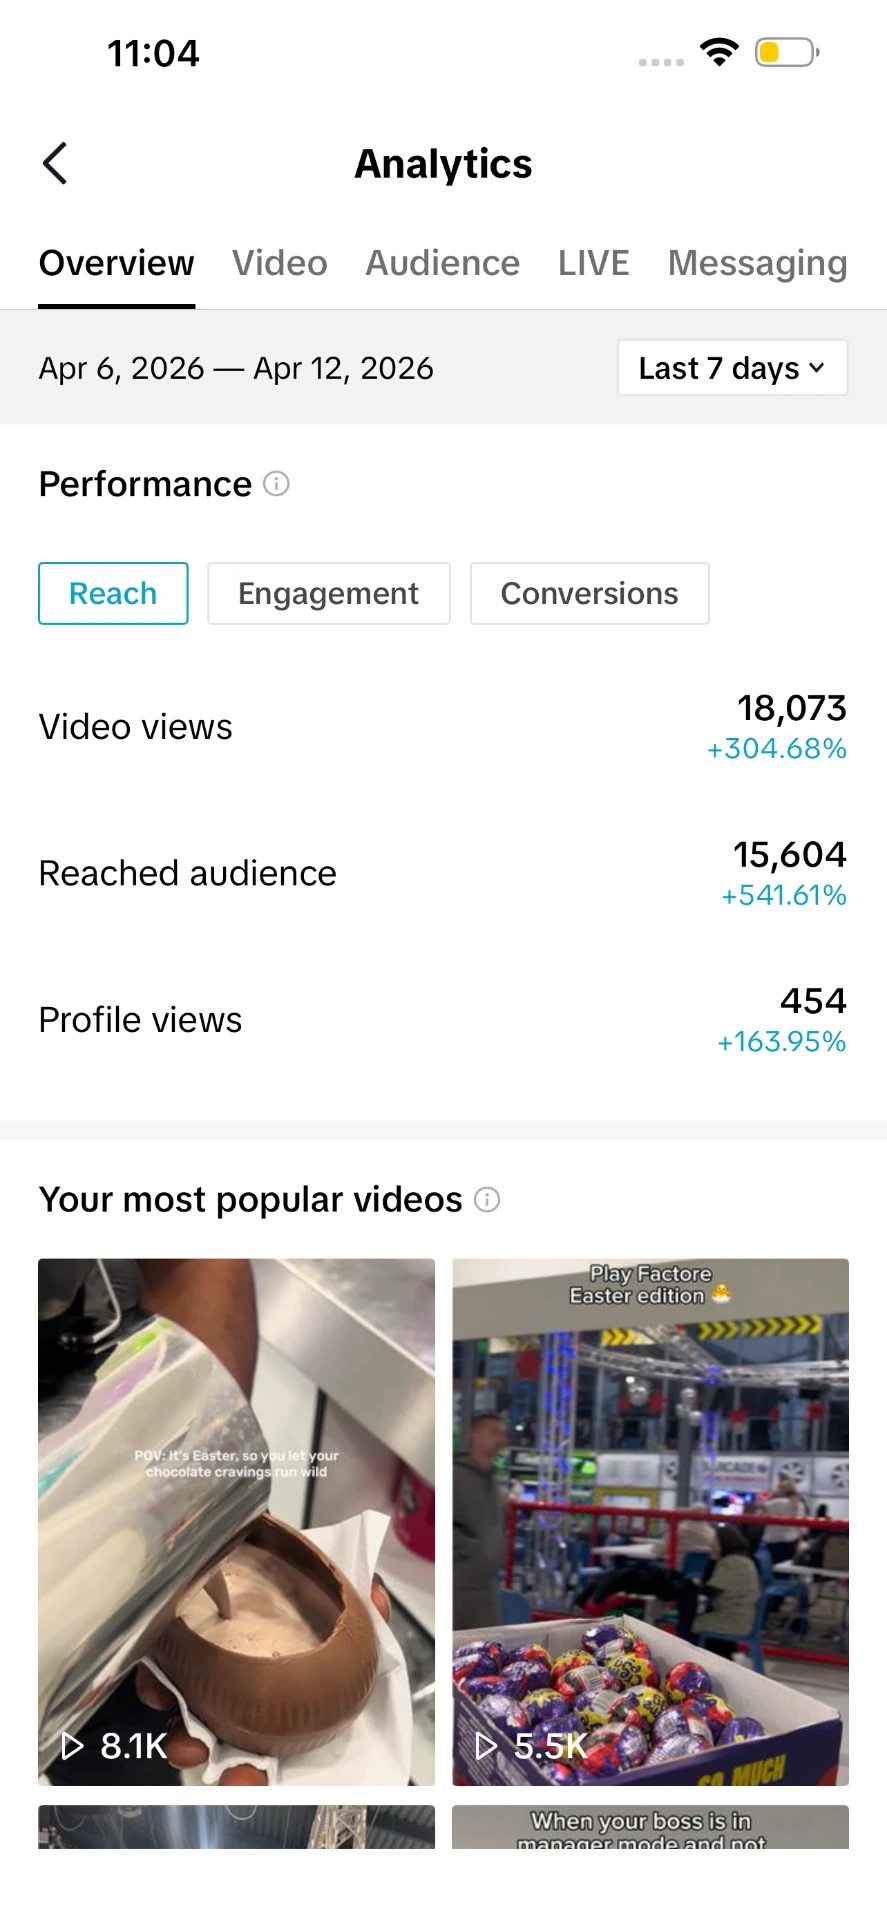
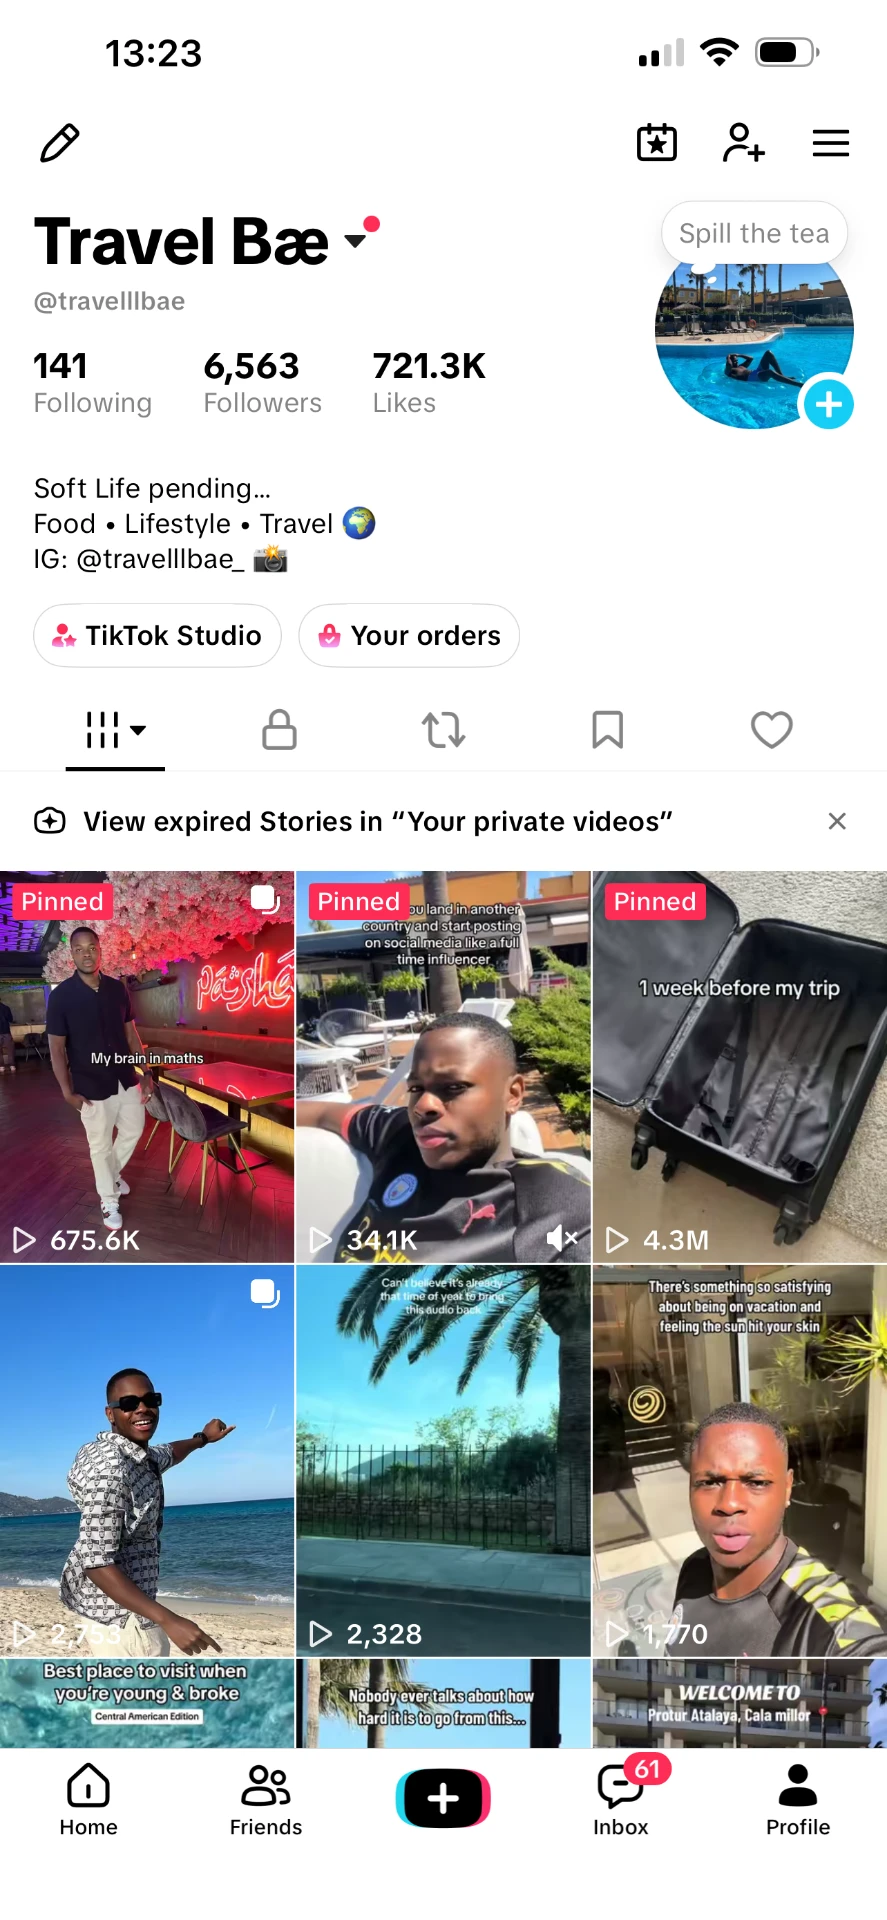
TikTok at 1,356 followers — the starting point before the content funnel.
Play Factore.
Beyond the numbers.
What the growth, content and audience data reveal about the social strategy — and where I would take it next.
620,396
Total views / 90 days
+59% vs comparison shown
+11.3%
Follower growth
8,486 total followers
20K
Reel interactions
Leading content format
85%
Audience / women
94.8% UK-based audience
A growing community
The account reached 8,486 followers, up 11.3%. The custom audience window records 856 net new followers — growth after unfollows, not just new follows.
My reading
The audience is growing alongside visibility. The next question is which individual posts convert discovery into follows, so those formats can be repeated deliberately.
The 90-day summary shows 620,396 views (+59%). Views measure content exposure, including repeat viewing — not unique people reached.
Reels do the heavy lifting
551K Reel views and 20K interactions make short-form video the standout format. Stories recorded 62K views and 92 interactions; posts recorded 6.9K views and 45 interactions.
My next move
Prioritise Reels for discovery; use Stories to support offers, FAQs and return visits. Compare formats within the same reporting window before shifting resources.
8.7K profile visits · 577 bio link taps · 128 address taps. These show intent to explore, not confirmed bookings or sales.
An audience that fits
85% women, with 82.9% of the overall audience aged 25–44 (27.1% aged 25–34 and 55.8% aged 35–44). The audience is 94.8% UK-based and 96.7% English-speaking.
Strategic implication
This is a relevant starting point for a family venue: lead with the day-out experience, practical reassurance and value. Test parent-focused messaging rather than assuming every follower is a parent.
Country data supports UK relevance, but does not prove local reach. Town/city insights and booking data would help assess the venue’s catchment more precisely.
Learn from the winners
381K
Top video views / separate 180-day window
The content ranking shows several strong performers — 381K, 176K, 172K and 170K views. Relatable moments and venue-led experiences are useful creative territories to test again.
- 01Identify the hook, subject and format behind each winner.
- 02Test new versions against comparable posts, not lifetime totals.
- 03Track the journey from views to profile visits, link taps and attributable bookings.